VCS Templates 
This turorial describes how to use CDAT's VCS's templates.
The CDAT software was developed by LLNL. This tutorial was written by Charles Doutriaux (18 Jan. 2017). This work was performed under the auspices of the U.S. Department of Energy by Lawrence Livermore National Laboratory under Contract DE-AC52-07NA27344.
In the VCS model, the data display is defined by a trio of named object sets, designated the “primary objects” (or “primary elements”). These include:
- Data Ingestion: The data, which drives the visualization, is ingested into the system via cdms2 or other numeric modules such as numpy.
- Graphics Method: The graphics method, which specifies the display technique.
- Template: The picture template, which determines the appearance of each segment of the display. Tables for manipulating these primary objects are stored in VCS for later recall and possible use.
This tutorial explains how to control the template and its relation to VCS's other primary objects.
Template elements
Generalities
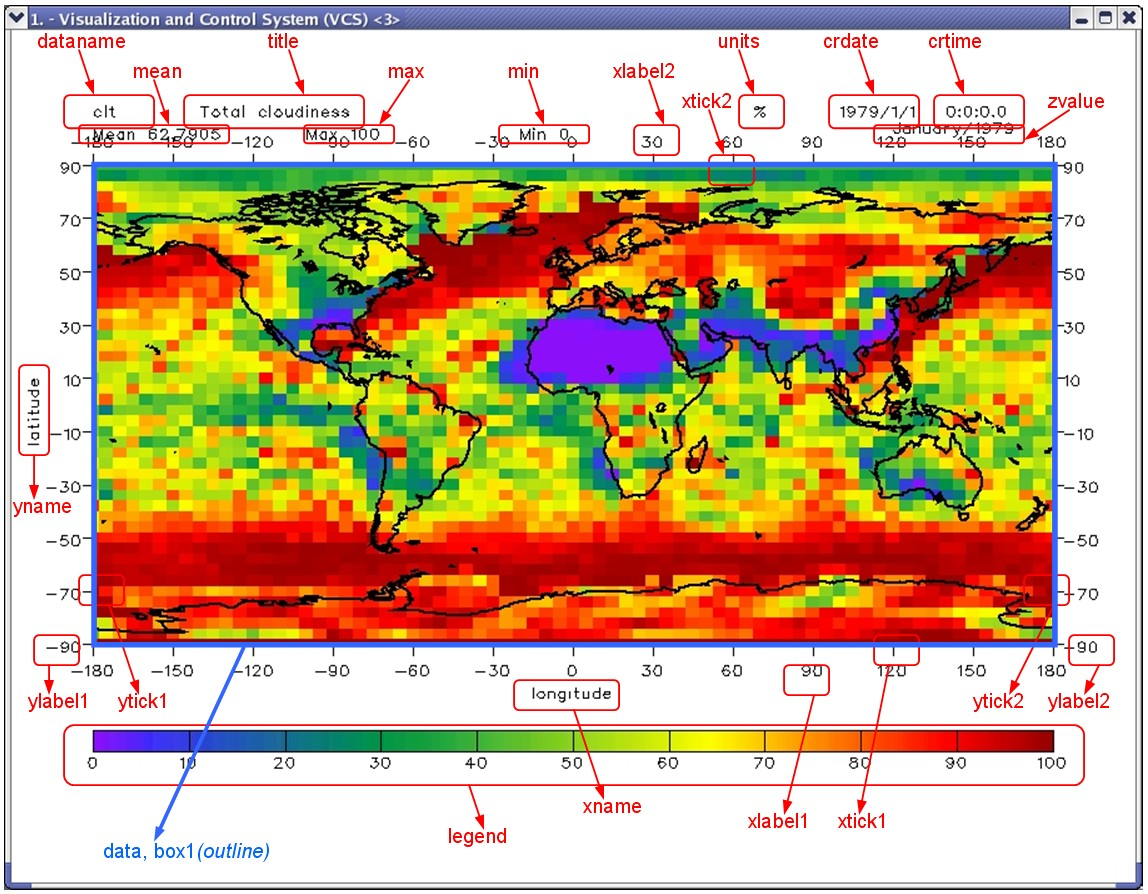
The template object allows the user to control where various elements of the plots are being drawn.
The following picture shows the various elements of a VCS image and the associated VCS template's atrribute:
To create a text object simply use the createtemplate function.
from __future__ import print_function  # For Python 2 compatibility
import vcs
x = vcs.init(bg=True)
template = vcs.createtemplate()
# the name is some bad random name:
print("template name:", template.name)
# If you want you can name your template object for easier retrieval later
# but keep in mind the name must be unique
try:
    template = vcs.createtemplate("vcs_is_easy")
except Exception:
    print("Ooops already have a template named like this")

print("Nice named template:", template.name)
# fails on second try
try:
    template = vcs.createtemplate("vcs_is_easy")
    print("It worked")
except Exception:
    print("Second try: Ooops already have a template named like this")
You can also list all of your existing templates and use one of them as a starting point.
mytemplates = vcs.listelements("template")
print("Existing templates:", mytemplates)  # notice the randomly named ones
template = vcs.createtemplate(source="vcs_is_easy")
Now in order to use this template either pass the template object to the vcs plot function.
# Get some data to plot
vcs.download_sample_data_files()
import cdms2
import os
with cdms2.open(os.path.join(vcs.sample_data,"ta_ncep_87-6-88-4.nc")) as f:
    data = f("ta")
# we need
x.plot(data, template)

Now let's learn how to customize template objects.
To see the list of available attributes on a template (and their own attributes/values) use the list() function.
template.list()
Data attribute
One of the most important attributes is the data attribute. It controls where the data will be drawn.
Note that changing the data attribute alone is not sufficient; other attributes will need to be moved as well. See the latter part of this tutorial for utility functions to help you manipulate everything at once.
Let's try to move the data to the upper left part of the canvas.
All units are in percentage (%) of the canvas; the 0 representing the lower/left corner of the canvas and 1 the upper/right corner).
The data attribute has 5 sub-attributes:
priority: the priority represents the layer on which the attribute will be drawn. A higher number means the attribute will be drawn on top of attributes with lower numbers.x1: The lower left corner horizontal location (in %).x2: The upper right corner horizontal location (in %).y1: The lower left corner vertical location (in %).y2: The upper right corner vertical location (in %).
template.data.x1 = .1 # 10% from left
template.data.x2 = .45  # 45% from left
template.data.y1 = .45  # 45% from bottom
template.data.y2 = .85  # 15% from top (or 85% from bottom)

x.clear()
x.plot(data,template)

As mentioned, other attributes need to be moved as well. First let's move the box around the data area. It is controlled via box1 which has the following attributes:
template.box1.list()
The new attribute here is the line attribute. You can use any line object from vcs (or create one).
print(vcs.listelements("line"))
template.box1.line = "red"
# let's copy
template.box1.x1 = template.data.x1
template.box1.x2 = template.data.x2
template.box1.y1 = template.data.y1
template.box1.y2 = template.data.y2

x.clear()
x.plot(data,template)

Tick Marks
Now let's move the tick marks. There are two types of tick marks: "major" and "min". The main difference is that "major" tick marks have text associated with them.
There are tick marks for the x axis and for the y axis. Each axis has two sets of tick marks. By default 1 is for the left/bottom tick marks while 2 is for the right/top ones.
With this in mind, the tickmark attributes are:
xtic1, xtic2, xmintic1, xmintic2,
ytic1, ytic2, ymintic1, ymintic2,
Major Ticks
For example, for xtic1 the attributes are:
template.xtic1.list()
priority: the priority represents the layer on which the attribute will be drawn. A higher number means the attribute will be drawn on top of attributes with lower numbers.y1: start of tick line in the vertical direction (in % of canvas).y2: end of tick line in the vertical direction (in % of canvas).line: a vcs line object (or name) to use for the line.
Similarly for the y ticks:
template.ytic1.list()
priority: the priority represents the layer on which the attribute will be drawn. A higher number means the attribute will be drawn on top of attributes with lower numbers.x1: start of tick line in the horizontal direction (in % of canvas).x2: end of tick line in the horizontal direction (in % of canvas).line: a vcs line object (or name) to use for the line.
Note that a template only controls the extent of the tick marks, not their location/values. This is controlled via the graphic method's [x/y]ticlabels[1/2] and [x/y]mtics[1/2] attributes.
Let's set the tick marks properly.
First set of major ticks (x/y)
# x major tick marks for first set of tick marks (1) drawn all the way across with grey lines
template.xtic1.y1 = template.data.y1
template.xtic1.y2 = template.data.y2
grey = vcs.createline()
grey.color = ['grey',]
grey.width = [2]
template.xtic1.line = grey  # uses line object

# y major for first set of tick marks (1) drawn all the way across with darker grey lines
template.ytic1.x1 = template.data.x1
template.ytic1.x2 = template.data.x2
grey2 = vcs.createline()
grey2.color = [(40, 40, 40),]
grey2.width = [2,]
template.ytic1.line = grey2.name  # uses line name

x.clear()
x.plot(data, template)

Second set of major ticks (x/y)
# x major tick marks for second set of tick marks (2) drawn outward in red
template.xtic2.priority=1  # turn on
template.xtic2.y1 = template.data.y2
template.xtic2.y2 = template.data.y2 + .01 # extend a bit further
template.xtic2.line="red"

# y major for second set of tick marks (2) drawn outward in red
template.ytic2.priority=1  # turn on
template.ytic2.x1 = template.data.x2
template.ytic2.x2 = template.data.x2 + .01 # extends a bit past it
template.ytic2.line = "red"
x.clear()
x.plot(data, template)

Minor ticks (x/y)
Let's do the same for the minor tics or mintics, except using dotted lines and not extending them as far.
# x minor tick marks (set 1) drawn all the way across with grey lines
template.xmintic1.priority = 1
template.xmintic1.y1 = template.data.y1
template.xmintic1.y2 = template.data.y2
grey = vcs.createline(source=grey.name)
grey.type= ["dot",]
template.xmintic1.line = grey  # re-uses line object

# y minor (set 1) drawn all the way across using darker grey lines
template.ymintic1.priority = 1
template.ymintic1.x1 = template.data.x1
template.ymintic1.x2 = template.data.x2
grey2 = vcs.createline(source=grey2.name)
grey2.type= ["dot",]
template.ymintic1.line = grey2.name  # uses line name

# x minor tick marks (set 2) drawn outward in red (a bit less)
template.xmintic2.priority=1  # turn on
template.xmintic2.y1 = template.data.y2
template.xmintic2.y2 = template.data.y2 + .005 # extend a bit further
template.xmintic2.line="red"

# y minor (set 2) drawn outward in red
template.ymintic2.priority=1  # turn on
template.ymintic2.x1 = template.data.x2
template.ymintic2.x2 = template.data.x2 + .005 # extends a bit past it
template.ymintic2.line = "red"

x.clear()
x.plot(data, template)

# too many tics; let's reduce their number
box = vcs.createboxfill()
box.xticlabels1 = {-180:"180W", -90:"90W", 0:"0", 90:"90E", 180:"180E", 270:"270E", 360:"0"}
box.xticlabels2 = box.xticlabels1 # same on both ends
box.yticlabels1 = {-90:"90S", -60:"60S", 0:"Eq", 60:"60N", 90:"90N"}
box.yticlabels2 = box.yticlabels1

# min ticks
box.xmtics1 = {-135:"135W", -45:"45W", 45:"45E", 135:"135E", 315:"315E"}
box.xmtics2 = box.xmtics1
box.ymtics1 = {-45:"45S", 45:"45N"}  # text does not matter as not drawn
box.ymtics2 = box.ymtics1

x.clear()
x.plot(data, box, template)

Axes Labels
Now we also need to move the actual values on the major tick marks. These are controlled via
xlabel1, xlabel2, ylabel, ylabel2.
Attributes on these are:
template.xlabel1.list()
priority: the priority represents the layer on which the attribute will be drawn. A higher number means the attribute will be drawn on top of attributes with lower numbers.y: location of the label in the vertical direction (in % of canvas).texttable: vcs texttable object or name.textorientation: vcs textorientation object or name.For more info on
texttableandtextorientationplease see the vcs text objects notebook.
First set of labels
text = vcs.createtext()
text.font = "Courier"
text.color = "blue"
text.angle = -45

template.xlabel1.priority=1
template.xlabel1.texttable = text.Tt_name
template.xlabel1.textorientation = text.To_name
template.xlabel1.y = template.data.y1 - .03

text = vcs.createtext()
text.font = "Times"
text.color = "salmon"
text.angle = -90

template.ylabel1.priority=1
template.ylabel1.texttable = text.Tt_name
template.ylabel1.textorientation = text.To_name
template.ylabel1.x = template.data.x1 - .01

x.clear()
x.plot(data, template, box)

Second set of labels
text = vcs.createtext()
text.font = "Courier"
text.color = "red"
text.angle = -45
text.halign="right"
text.valign="top"

template.xlabel2.priority=1
template.xlabel2.texttable = text.Tt_name
template.xlabel2.textorientation = text.To_name
template.xlabel2.y = template.data.y2 + .04

text = vcs.createtext()
text.font = "Adelon"
text.color = "pink"
text.angle = 90

template.ylabel2.priority=1
template.ylabel2.texttable = text.Tt_name
template.ylabel2.textorientation = text.To_name
template.ylabel2.x = template.data.x2 + .01

x.clear()
x.plot(data, template, box)

Axis names
The position of the axes is controlled via the xname and yname attributes.
Their attributes are:
template.xname.list()
priority: the priority represents the layer on which the attribute will be drawn. A higher number means the attribute will be drawn on top of attributes with lower numbers.x: location of the label in the horizontal direction (in % of canvas).y: location of the label in the vertical direction (in % of canvas).texttable: vcs texttable object or name.textorientation: vcs textorientation object or name.For more info on
texttableandtextorientationplease see the vcs text objects notebook.
text = vcs.createtext()
text.color = "blue"
text.height = 15
text.halign = "center"
text.font = "Courier"

template.xname.x = (template.data.x1 + template.data.x2) / 2.
template.xname.y = template.data.y1 -.05
template.xname.texttable = text.Tt_name
template.xname.textorientation = text.To_name
template.xname.x = (template.data.x1 + template.data.x2) / 2.
template.xname.y = template.data.y1 -.06

text = vcs.createtext()
text.color = "salmon"
text.height = 25
text.valign = "half"
text.halign = "center"
text.angle = -90
text.font = "Times"
template.yname.texttable = text.Tt_name
template.yname.textorientation = text.To_name
template.yname.x = template.data.x1 -.04
template.yname.y = (template.data.y1 + template.data.y2) / 2.

x.clear()
x.plot(data, box, template)

Legend attribute
Now we need to move the legend bar. This is done via the legend attribute. Its attributes are:
template.legend.list()
priority: the priority represents the layer on which the attribute will be drawn. A higher number means the attribute will be drawn on top of attributes with lower numbers.x1: start of the legend box in the horizontal direction (in % of canvas).x2: end of the legend box in the horizontal direction (in % of canvas).y1: start of the legend box in the vertical direction (in % of canvas).y2: end of the legend box in the vertical direction (in % of canvas).texttable: vcs texttable object or name.textorientation: vcs textorientation object or name.offset: how far from the bar the text should be (in % of canvas).For more info on
texttableandtextorientationplease see the vcs text objects notebook.
Depending on whether the legend is horizontal/vertical, the x1/y1 attributes determine the side where the legend will be drawn.
The legend labels themselves are controlled via the graphic method's legend attribute.
Let's have a vertical legend with labels on the right side.
template.legend.x1 = template.data.x2 + .08
template.legend.x2 = template.data.x2 + .06
template.legend.y1 = template.data.y1 + .02
template.legend.y2 = template.data.y2 - .02
text = vcs.createtext()
text.color = "cyan"
text.height=12
text.angle=-45
template.legend.texttable = text.Tt_name
template.legend.textorientation = text.To_name
template.legend.offset = .015

box.legend = {220:"Cold", 320:"HOT!", 270:"Mild"}
x.clear()
x.plot(data, template, box)

Text controlling attributes
In addition, the template lets you display elements associated with the data itself.
All the following attributes have the same set of their own attributes:
template.dataname.list()
priority: the priority represents the layer on which the attribute will be drawn. A higher number means the attribute will be drawn on top of attributes with lower numbers.x: text position in the horizontal direction (in % of canvas).y: text position in the vertical direction (in % of canvas).texttable: vcs texttable object or name.textorientation: vcs textorientation object or name.For more info on
texttableandtextorientationplease see the vcs text objects notebook
Elements Controlled by Data Values
The mean, min, and max attributes' values are controlled by the input plotted, not the full array. For example, if you plot a 3D array with a boxfill, the values will be determined by the 2D data plotted, not by the full 3D array.
The mean value is plotted as follows:
- Does the data have a
meanattribute? If yes, use this. - Try to apply
cdutil.averager(data). If passes, use this. - Everything else failed: use
numpy.ma.average(data).
template.max.x = template.data.x2 + .2
template.max.y = template.data.y2
template.min.x = template.data.x2 + .2
template.min.y = template.max.y - .03
template.mean.x = template.data.x2 + .2
template.mean.y = template.min.y - .03

x.clear()
x.plot(data, box, template)

Elements Controlled by Data Attributes
The main ones are:
source, dataname, title, units.
The following are legacy convenience attributes from the time when VCS was a GUI only. They are:
file, function, logicalmask, transformation, comment1, comment2, comment3, comment4.
Here is the mapping of these attributes to the attribute on the data:
dataname $\leftarrow$ $\rightarrow$ id
title $\leftarrow$ $\rightarrow$ long_name
source $\leftarrow$ $\rightarrow$ source
units $\leftarrow$ $\rightarrow$ units
file $\leftarrow$ $\rightarrow$ file
function $\leftarrow$ $\rightarrow$ function
logicalmask $\leftarrow$ $\rightarrow$ logicalmask
transformation $\leftarrow$ $\rightarrow$ transformation
comment1 $\leftarrow$ $\rightarrow$ comment1
comment2 $\leftarrow$ $\rightarrow$ comment2
comment3 $\leftarrow$ $\rightarrow$ comment3
comment4 $\leftarrow$ $\rightarrow$ comment4
data.id = "DATANAME"
data.long_name = "TITLE HERE"
template.dataname.x = template.data.x2 + .3
template.dataname.y = template.data.y2

for i, att in enumerate("source title units file function logicalmask transformation comment1 comment2 comment3 comment4".split()):
    attr = getattr(template,att)
    attr.priority = 1
    attr.x = template.dataname.x
    attr.y = template.dataname.y - (i+1)*.025
    setattr(data,att, "{} HERE".format(att.upper()))

x.clear()
x.plot(data, box, template)

Elements Controlled by the Attributes of the Data's Axes
The following text values are determined based on the values of the input array axes.
xname, yname, ztname, tname,
xunits, yunits, zunits, tunits,
xvalue, yvalue, zvalue, tvalue,
crdate, crtime
Where x, y, z, t represent the axes from the last index:
x $\leftarrow$ $\rightarrow$ data.getAxis(-1)
y $\leftarrow$ $\rightarrow$ data.getAxis(-2)
z $\leftarrow$ $\rightarrow$ data.getAxis(-3)
t $\leftarrow$ $\rightarrow$ data.getAxis(-4)
crdate and crtime will try to obtain the time axis (data.getTime()) and use the current time point to determine the date (format: {:%Y/%m}) and time I(format: {:%H-%M-%S})
for i, axis in enumerate(["x","y","z","t"]):
    ax = data.getAxis(-i-1)
    print("Ax.id, units, val", ax.id, ax.units, ax[0])
    for j, attribute in enumerate(["name","units", "value"]):
        att = "{}{}".format(axis,attribute)
        if att in ["xname", "yname"]:  # we already touched these
            continue
        obj = getattr(template,att)
        obj.priority = 1
        obj.x = template.data.x1 + (i+1)*.2
        obj.y = template.data.y1 - (j+2)*.05
        #obj.list()

template.crdate.x = template.tunits.x
template.crdate.y = template.tvalue.y - 0.05
template.crtime.x = template.crdate.x
template.crtime.y = template.crdate.y - 0.05


x.clear()
x.plot(data, template, box)

Lines and Boxes
Again as legacy features from when VCS was purely GUI-based, the template lets you draw 4 boxes and 4 lines. The box1 usually is reserved for the box around the data area.
Their attributes are:
template.box1.list()
Template Utilities
Now that we understand how each attribute works, let's take a look at some of the built-in utility functions for VCS objects to help us manipulate all this a bit faster.
Scaling Functions
The following functions allow you to scale all of a template's elements.
scale
Signature: template.scale(scale, axis='xy', font=-1)
Scale a template along the axis 'x' or 'y' by scale defaults to 'xy' (both). Values of scale greater than 1 mean increase. The reference point is the template's x1 and y1 data. (i.e. this point will be unchanged). Fonts are scaled as well but can be left untouched.
template = vcs.createtemplate()
template.scale(.5)
x.clear()
x.plot(data,template)

# Now, not touching the fonts
template = vcs.createtemplate()
template.scale(.5,font=0)
x.clear()
x.plot(data, template)

scalefont
We can scale the font at a later time.
template.scalefont(.7)
x.clear()
x.plot(data, template)

ratio
Alternatively we can ask the template to get a specific ratio for the data area.
The ratio means the y direction will be ratio times the x direction.
The box_and_ticks option also scales box and ticks, or not (default on).
template = vcs.createtemplate()
template.ratio(2)
x.clear()
x.plot(data, template)

# we can also NOT scale ticks
template = vcs.createtemplate()
template.ratio(2, box_and_ticks=False)
x.clear()
x.plot(data, template)

template = vcs.createtemplate()
template.scale(.5,font=False)
template.scalefont(.8)
template.move(.25,'x')
template.move(.25,'y')
x.clear()
x.plot(data, template)

moveto
Sometimes it is preferable to move to a destination point rather than a percent (%).
Here the data x1/y1 will be moved to this location.
template = vcs.createtemplate()
template.scale(.5,font=False)
template.scalefont(.8)
template.moveto(.5, .1)
x.clear()
x.plot(data, template)

Plot Functions (Advanced Users)
drawColorBar
This function draws the colorbar. It needs:
- colors : The colors to be plotted.
- levels : The levels that each color represents.
- legend : Draw a box at certain values and display some specific text instead of the value. (This will overwrite the existing legend.)
- ext_1 and ext_2: to draw the arrows.
- x : the canvas, where to plot it.
template = vcs.createtemplate()
x.clear()
template.drawColorBar(["red","white", "blue","green"],
                      [0,50, 100, 1.e20],
                      {0:"EMPTY", 50:"HALF", 100:"FULL"},
                      ext_2=True, x=x)
template2 = vcs.createtemplate()
template2.legend.priority = 0
x.plot(data,template2)

drawLinesAndMarkersLegend
This function allows users to draw a legend box with lines and markers.
Draws a legend with line/marker/text inside a template legend box. Auto adjusts text size to make it fit inside the box. Auto arranges the elements to fill the box nicely.
template.drawLinesAndMarkersLegend( ['canvas', 'linecolors', 'linetypes', 'linewidths', 'markercolors', 'markertypes', 'markersizes', 'strings', 'scratched=None', 'stringscolors=None', "stacking='horizontal'", 'bg=False', 'render=True', 'smallestfontsize=None', 'backgroundcolor=None'], )
- canvas: a VCS canvas object onto which to draw the legend
- linecolors: A list containing the colors of each line to draw. Colors are represented as either an integer from 0-255, an RGBa tuple, or a string color name.
- linetypes: A list containing the type of each line to draw.
Line types are represented as either integers or strings.
See :py:class:
vcs.line.Tlfor more information. - linewidths: A list containing numbers in float format representing the width of each line.
- markercolors: A list of the marker colors to draw. Colors are represented as either an integer from 0-255, an RGBa tuple, or a string color name.
- markertypes: A list of the marker types to draw.
Marker types are represented as either integers or strings.
See :py:class:
vcs.marker.Tmfor more information. - markersizes: A list of numbers in float format representing marker sizes.
- strings: A list of strings to draw next to each line/marker.
scratched: A list indicating which strings should be "scratched" off in the template.
To "scratch" a string, the corresponding location in the scratched list must contain either True or the line type to use for the scratch. A value of False at a given index will leave the corresponding index of strings untouched.
Size of the scratched list must be equal to the size of the strings list.
Scratch color will match that of text.
If scratched is None, or is not provided, no strings will be scratched.
- stringscolors: A list of the string colors to draw. Colors are represented as either an integer from 0-255, an RGBa tuple, or a string color name.
- stacking: Prefered direction to stack element ('horizontal' or 'vertical')
- bg: Boolean value indicating whether or not to draw in the background. Defaults to False.
- render: Boolean value indicating whether or not to render. Defaults to True.
- smallestfontsize: Integer value indicating the smallest font size we can use for rendering None means no limit, 0 means use original size. Downscaling will still be used by algorigthm to try to fit everything in the legend box.
- backgroundcolor: A list indicating the background color of the legend box. Colors are represented as either an integer from 0-255, an RGBa tuple, or a string color name.
template = vcs.createtemplate()
template2.scale(.5)
x.clear()
l_colors=["red","blue","green"]
l_types=["solid","dash","dot"]
l_widths=[1,4,2]
m_colors=["blue","green","red"]
m_types=["cross","square","dot"]
m_sizes=[1,2,.5]
strings=["sample A","type B","thing C"]
scratch=[True,False,True]
background = 'grey'
template.legend.x1 = .85
template.legend.x2 = .99
template.legend.y1 = .2
template.legend.y2 = .8
template.drawLinesAndMarkersLegend(x, l_colors, l_types, l_widths,
                                   m_colors, m_types, m_sizes, strings, scratch,
                                   backgroundcolor=background)
x.plot(data,template2)

The attributes you pass to the blank function will not be shown on the plot. In the next example, "mean", "crdate", "crtime", "min", and "dataname" have been removed from the standard plot which normally shows these attributes.
template = vcs.createtemplate()
template.blank(["mean", "crdate", "crtime", "min", "dataname"])
x.clear()
x.plot(data, template)

If no attributes are passed, then everything is turned off except for data.
template = vcs.createtemplate()
template.blank()
x.clear()
x.plot(data, template)

Special Case: Taylor Diagrams
Taylor Diagrams are controlled a bit differently. The default template used for Taylor Diagrams is: deftaylor.
The image below describes how elements of a Taylor Diagram are controlled by the template:
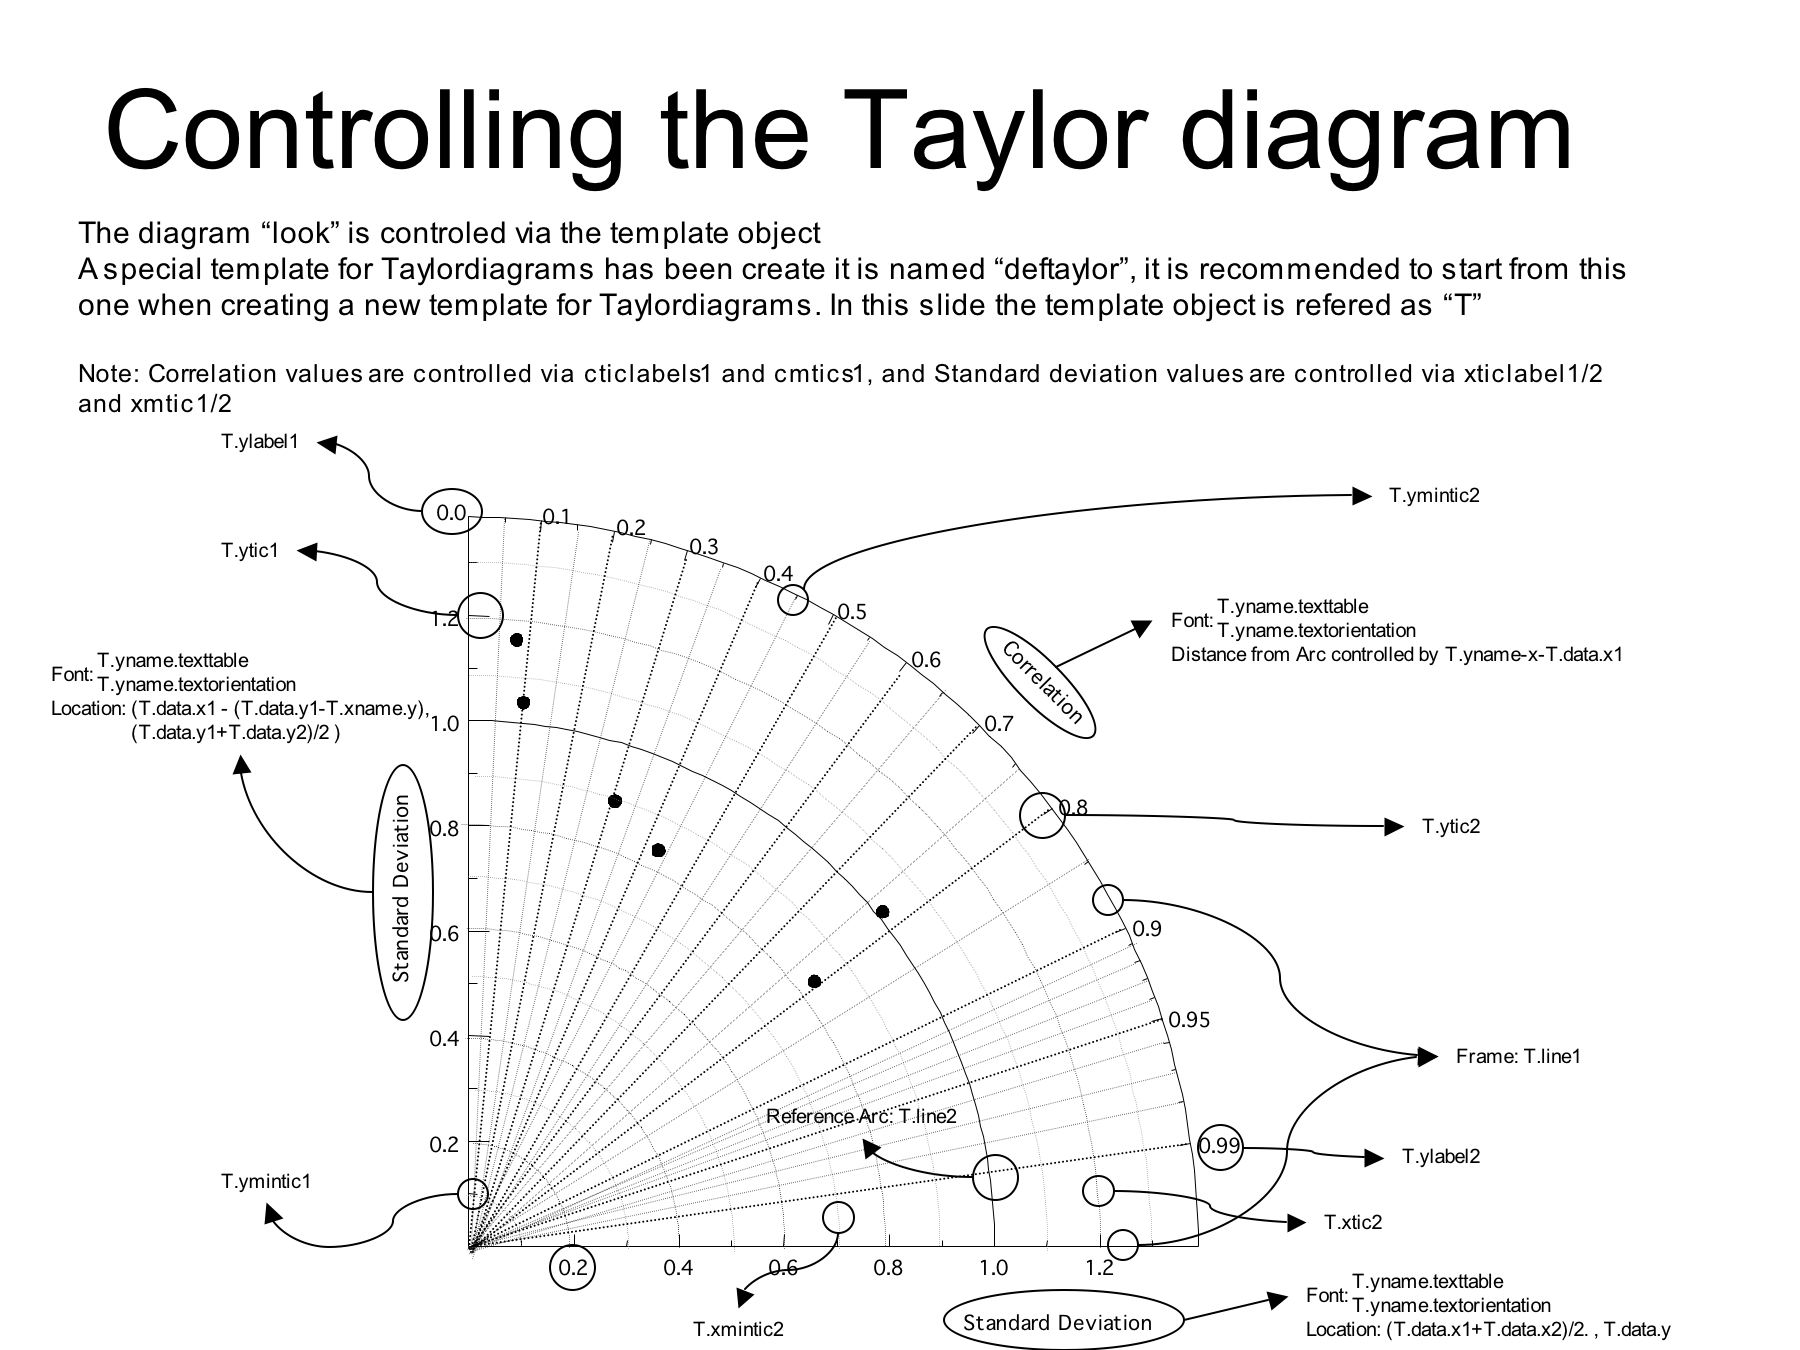
For more on Taylor Diagrams, please see the Taylor Diagram Tutorial.
VCS Addons
The VCS Addons provide a few utilities to help with templates.
Multiple Rows and Columns
This package allows you to easily create templates for multiple rows/columns.
Let's display the first 6 plots.
import vcsaddons
x.clear()
template = vcs.createtemplate()
template.blank(["transformation", "source", "dataname", "function", "logicalmask",
                "comment1", "comment2", "comment3" ,"comment4", "title", "file"])
Multi = vcsaddons.EzTemplate.Multi(rows=2, columns=3, template=template)
Multi.spacing.horizontal = .08
Multi.spacing.vertical = .1
Multi.margins.bottom = .2 # lots of space at bottom
local_legend = ["global", "local", None, "local", "local", None]
for i in range(6):
    mytemplate = Multi.get(column=i%3, row=i//3, fontlimit=.8, legend=local_legend[i])
    d = x.plot(data[i], mytemplate)
d

Line (Spaghetti) Plots
Because the legend's position comes from the template, plotting multiple line plots together can be a problem as one template needs to be created for each line plot.
The EzPlot module helps with this.
import os
import cdutil
import math
import random
import vcsaddons.EzPlot

x.clear()
# Simple Plot with EzPlot


variables  = []
line_type  = []
line_widths = []
legend_texts = []
legend_text_colors = []
marker_type = []

for v in range(0, 20):
    var = []
    for i in range(0, 100):
        if v%2 == 0:
            #var.append(random.random() * v * math.sin(2*math.pi*float(i-v)/100.0))
            var.append(v * math.sin(2*math.pi*float(i-v)/100.0))
        else:
            #var.append(random.random() * v * math.cos(2*math.pi*float(i-v)/100.0))
            var.append(v * math.cos(2*math.pi*float(i-v)/100.0))
    line_type += ["solid"]
    line_widths += [5]
    if i%2 == 0:
        legend_texts += ["Sin"]
    else:
        legend_texts += ["Cos"]
    legend_text_colors += ['black']
    marker_type += [None]
    variables.append(var)

plotfunction = vcsaddons.EzPlot.EzLinePlot()

d = plotfunction.lineplot(data=variables, canvas=x, title="Simple 2 EzLinePlot", titlesize=30,
                          #backgroundcolor=[0, 100, 0],
                          linetypes=line_type, linewidths=line_widths,
                          legendposition=[0.25, 0.35, 0.30, 0.40], legendtextcolors=legend_text_colors,
                          legendtexts=legend_texts,
                          legendbackgroundcolor="yellow",
                          enablegrid=True)

d
